Pangasius catfish (Pangasius sp.) farming continues to shine as a leading commodity in Indonesia's freshwater fisheries sector, and for good reason. The fish is known for its distinct biological advantages: it converts feed efficiently, tolerates a wide range of water quality, and grows remarkably fast. Coupled with a stable market price and consistently high consumer demand, Pangasius has become a compelling choice for many aquaculture farmers.
However, behind this potential lies a complex business reality. A successful Pangasius farm cannot be run on guesswork. It requires meticulous planning and a thorough business analysis to ensure that the initial investment yields profit, not loss. A key indicator of success is cost efficiency. Expenses can range from fingerlings and feed to labor and operational overhead. If not managed effectively, these costs can quickly erode profits and undermine the entire venture.
Business analysis serves as a critical tool for assessing the viability and profitability of a grow-out farm. Key parameters include total production costs, revenue, net profit, the Revenue/Cost (R/C) ratio, and the Break-Even Point (BEP) for both production volume and price.
To illustrate, consider a hypothetical farm with a 500-square-meter (approx. 5,380-square-foot) pond. In a single cultivation cycle, the fixed costs might be around IDR 1,105,941 (approx. USD 67), with variable costs reaching IDR 82,183,250 (approx. USD 5,011), bringing total production costs to IDR 83,289,191 (approx. USD 5,078). If this pond yields 9,555 kg of fish sold at an average price of IDR 14,937.5 per kg, the total revenue would be IDR 142,721,250 (approx. USD 8,702).
This scenario would generate a net profit of IDR 59,432,058 (approx. USD 3,624) for the cycle. The resulting R/C ratio of 1.81 means that every dollar invested generates USD 1.81 in revenue, signaling a healthy return.
1. Analysis of production costs
In Pangasius aquaculture, production costs are a foundational element determining a farm's efficiency and financial health. These costs are broadly divided into two categories: fixed costs and variable costs.
Fixed Costs (FC) are expenses that do not change with the volume of production. Whether the harvest is large or small, these costs remain relatively constant. In fish farming, they typically include land rent, depreciation of equipment (like pumps and nets), and salaries for permanent staff. Based on an analysis published in the Jurnal Ilmu-ilmu Perikanan dan Budidaya Perairan (JIPBP), fixed costs per cycle in Banyuasin Regency ranged from IDR 484,667 to IDR 1.5 million (approx. USD 30 to USD 91), depending on the scale of the operation.
Variable Costs (VC), on the other hand, are directly tied to production volume. These expenses rise as the number of fish being cultivated increases and include the purchasing of fingerlings, feed, medicine, and wages for daily laborers. The JIPBP study found a significant range for these costs, from IDR 49 million to IDR 163 million (approx. USD 2,988 to USD 9,939) per cycle. This wide variance underscores a critical point: efficient management of variable costs, especially feed, is the single largest factor influencing profitability.
The total production cost (TC) is the sum of these two categories, calculated with the formula:
𝑇𝐶 = 𝐹𝐶 + 𝑉𝐶
For instance, in the 500-square-meter pond example, the total cost of approximately IDR 83.3 million is the sum of IDR 1.1 million in fixed costs and IDR 82.2 million in variable costs. This figure can vary dramatically based on the farm's size, operational management, and overall resource efficiency.

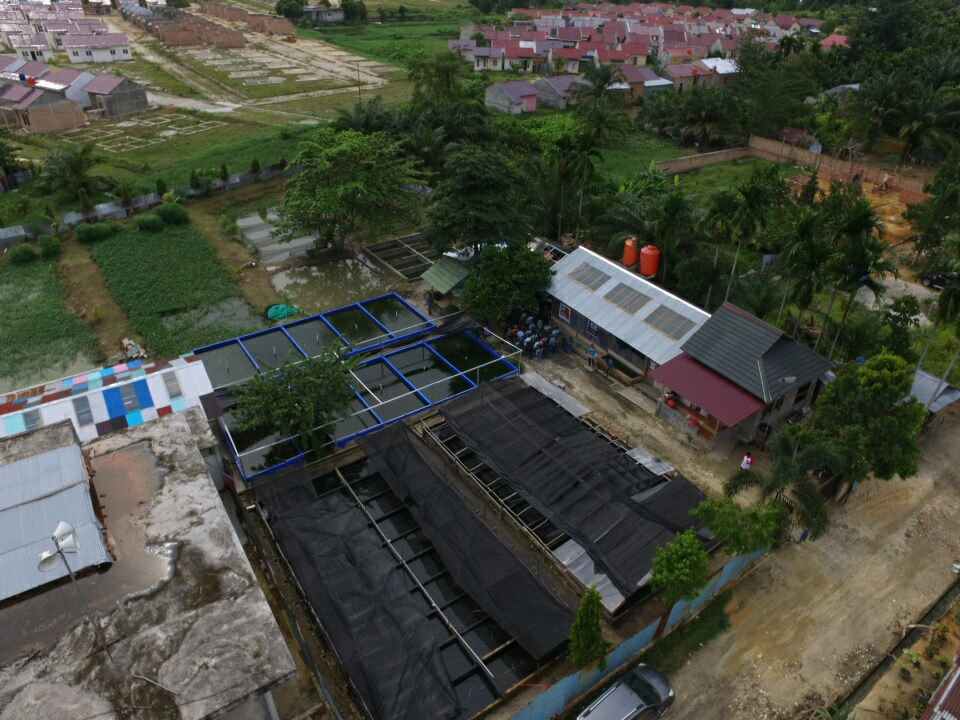
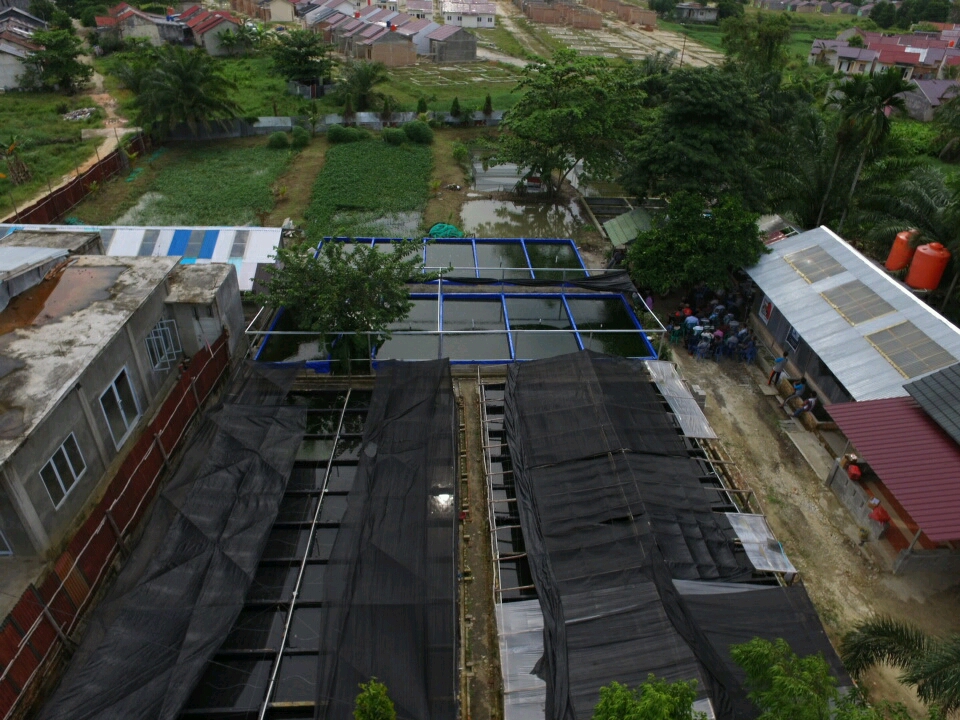
Pangasius cultivation business in West Sumatra was established in 2018 by Mr. Yose Rizal with a production capacity of around 6 tons per month: KKP RI
2. Revenue analysis
Revenue is the primary indicator of a farm's economic output. It is calculated by multiplying the total fish production (in kilograms) by the selling price per kilogram. The formula is:
𝑇𝑅 = 𝑃𝑦 × 𝑌
Here, TR is the total revenue, Py is the price per kilogram, and Y is the total production yield. Higher yields and better market prices directly translate to greater revenue potential for the farmer.
According to the JIPBP case study, the total revenue per cycle showed significant variation, ranging from IDR 87 million to IDR 235 million (approx. USD 5,305 to USD 14,329). This difference is driven by factors like pond size, technical management of the cultivation, and the survival rate of the fish until harvest. As an example, while a 500-square-meter pond might generate around IDR 142.7 million (approx. USD 8,700) in revenue, a larger 800-square-meter pond could yield over IDR 235 million (approx. USD 14,329) in a single cycle.
3. Analysis of net income (profit)
The ultimate measure of financial success in any business cycle is the net income, or profit. This figure represents the final earnings after all production activities are accounted for and is calculated by subtracting the total costs (TC) from the total revenue (TR):
𝐼 = 𝑇𝑅-𝑇𝐶
If total revenue exceeds total costs, the venture is profitable. Conversely, if costs outweigh revenue, the farm operates at a loss. This bottom line is the most direct indicator of a farm's financial health.
According to data from the JIPBP, the net income from Pangasius farming ranges from approximately IDR 18 million to IDR 69 million (about USD 1,100 to USD 4,200) per cycle, contingent on pond size and management efficiency. These figures highlight the significant profit potential within the industry. For instance, the 500-square-meter pond previously mentioned could generate a net income of around IDR 59.4 million (approx. USD 3,624) per cycle.
4. R/C ratio (revenue/cost ratio) analysis
The Revenue/Cost (R/C) ratio is a critical indicator of a venture's feasibility, as it illustrates the efficiency of production spending relative to the income generated. Calculated with the formula:
𝐵/𝐶 = 𝑇𝑅 / 𝑇𝐶
this metric helps an operator determine if the business is profitable, breaking even, or incurring a loss. An R/C ratio greater than 1 signifies that revenue exceeds costs, making the venture profitable.
The analysis published by JIPBP recorded R/C ratios for Pangasius farming between 1.33 and 1.81. This means that for every dollar of cost invested, the farm generated between USD 1.33 and USD 1.81 in revenue, depending on the scale of the operation. Such values indicate that Pangasius farming is an efficient and economically viable enterprise. Simply put, a higher R/C ratio translates to a wider profit margin on every dollar invested.
5. B/C ratio (benefit/cost ratio) analysis
Similarly, the Benefit/Cost (B/C) ratio is an analytical tool used to assess viability, but it focuses specifically on the relationship between net profit and total costs. The formula is:
𝐵/𝐶= (𝑇𝑅 – 𝑇𝐶) / 𝑇𝐶
or
𝐵/𝐶 = Net Profit / Total Cost
This ratio provides a clear picture of how much net profit is generated for every dollar of cost invested. A higher B/C ratio suggests a more financially attractive venture for development.
The interpretation is straightforward:
- A
B/C ratio > 0 indicates the venture is profitable and worthwhile. - A
B/C ratio = 0 means the business is at its break-even point. - A
B/C ratio < 0 signals a loss, suggesting the venture should not be pursued.
Based on the JIPBP data, the B/C ratios for the analyzed farms ranged from 0.33 to 0.81. This reveals that while profitability varies, all the analyzed operations were considered viable. The highest B/C ratio of 0.81 signifies that for every dollar of cost, the venture generated USD 0.81 in pure profit.
6. Break-even point (BEP) analysis
The Break-Even Point (BEP) is a crucial benchmark in business analysis, representing the moment when total revenue equals total costs. At this point, the business is neither making a profit nor a loss. For fish farmers, the BEP serves as a vital reference for the minimum production volume or sales price required to stay afloat and avoid losses.
There are two primary approaches to calculating this threshold:
- BEP Production: The minimum quantity of fish (in kilograms) that must be produced and sold to cover all costs.
- BEP Price: The minimum price per kilogram at which the fish must be sold to cover all costs.
The JIPBP study found the BEP for production ranged from
3,315.58 kg to 10,943.46 kg. The BEP for price fell between
IDR 8,537.72 and IDR 11,442.24 per kilogram (approx. USD 0.52 to USD 0.70/kg).
Economic Analysis of Pangasius Farming by Pond Size
The following table provides a detailed breakdown of the financial metrics across various farm sizes, as analyzed in the JIPBP study. All monetary figures are per cultivation cycle.

Table 1. Analysis of pangasius cultivation business
Currency: Indonesian Rupiah (IDR)
Source: Jurnal Ilmu-ilmu Perikanan dan Budidaya Perairan (JIPBP), Universitas PGRI Palembang
The economic landscape of Pangasius farming presents a compelling narrative of opportunity balanced by operational discipline. The data clearly shows that with sound management, this form of aquaculture is not just viable but highly profitable, capable of generating significant returns on investment. However, success is not a given. It is forged in the careful management of costs—particularly feed—and a deep understanding of the financial break-even points that separate sustainability from failure. For investors and farmers alike, the path to a profitable harvest lies not just in the water, but in the numbers. As demand for sustainable protein continues to grow globally, those who master the economics of the pond will be best positioned to thrive.